
Fernando Martin
Pre & Post Sales Manager
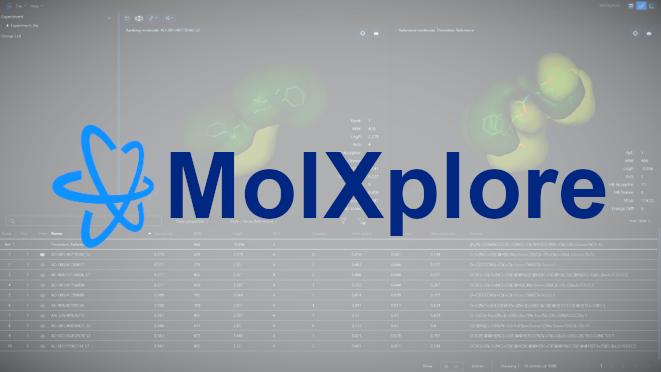
For some computational and medicinal chemists, a good graphical user interface (GUI) is essential. It makes it easier to analyze, understand and draw conclusions from results. And that is what MolXplore is: a novel and modern GUI that helps scientists visualize the potential compound candidates of a virtual screening campaign, analyze the results using the different options available, and draw the right conclusions about which compounds should be prioritized for further analysis, such as performing a docking campaign or directly purchasing the molecules for in vitro assays.
In this first version of MolXplore, scientists will be able to analyse the results of PharmScreen, our 3D ligand-based virtual screening software, by loading the results and analysing them according to different options, such as evaluating the similarity of the candidates with respect to the reference molecule, superimposing the molecular fields and the chemical structures, or filtering the compounds according to different physicochemical properties, …
Many ways to analyze your data
There are many ways to interact with your results in MolXplore:
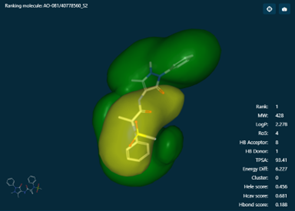
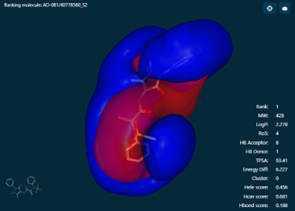
- Molecular viewer: Here you can evaluate different properties of your compounds, such as the molecular fields for 7 different properties, different physicochemical descriptors, the 2D representation of the molecule or overlay your compounds on the reference molecule. You will find different ways to represent your compounds, such as line, sticks or ball & stick.
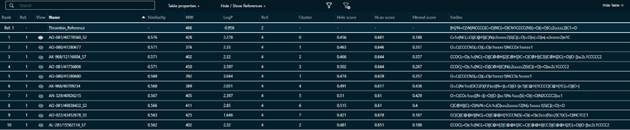
- Data table: This feature allows you to select, sort and filter the screened compounds based on various physicochemical properties. The table is synchronized with the molecular viewer to help you to make better decisions when selecting a compound as a candidate. The table also allows you also to group your compounds and download them in a single file.
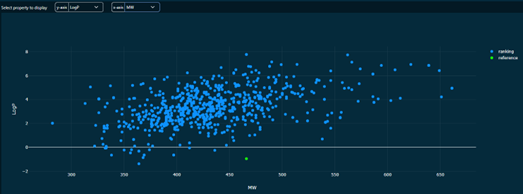
- Property plot: The plot feature will help you to gain a deeper understanding of your compounds, plotting two different properties at the same time, helping to understand, for example, how your compounds may cluster based on two different selected properties. The plot feature is synchronized with the data table as well as the viewer, completing the list of tools for extracting conclusions from your screening.
The GUI is compatible with Linux and Windows, so you can analyze the results from any computer. MolXplore is included in your PharmScreen license. Request your license now!