

By Alessandro Deplano – Jan. 9, 2021
Preselecting the final compound after a virtual HTS campaign is not an easy task. Once the screening tool has ranked all the molecules based on a score, the researcher has to make the final selection, a more complex task than simply choosing the best-ranked molecules from the list.
Pharmacelera has developed a Jupyter Notebook to help with the analysis of the vHTS results. This Python 3.0 tool uses the RDKit chemical toolbox to calculate different molecular parameters. The information generated is represented in the form of interactive graphs that the user can explore to make better decisions in choosing molecules with better properties.
In this post, we introduce the three kinds of analysis executed by our tool.
Fingerprint similarity score calculation
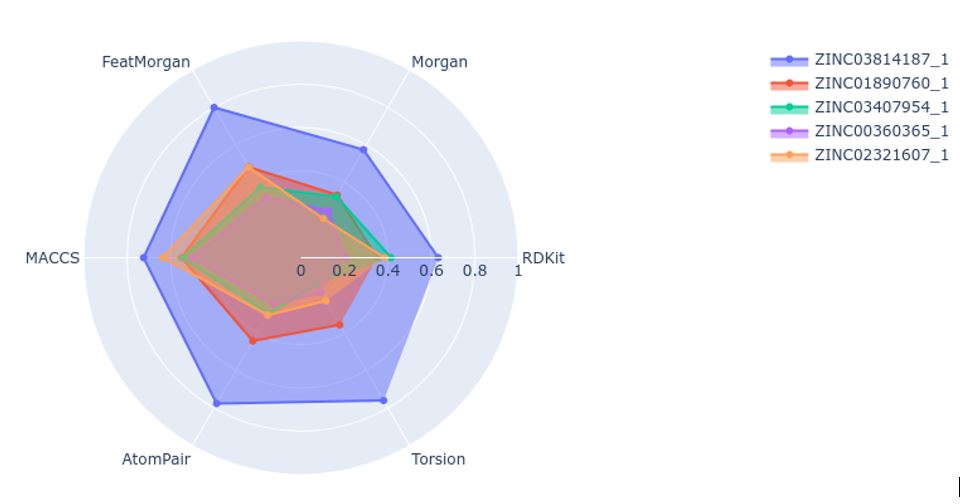
Analyzing a compound from different angles can highlight aspects (positive or negative) neglected in a first analysis to select it. A fast and straightforward way to perform this type of analysis is to calculate the similarity of the top-ranked molecules in your list to a known ligand (reference compound) using different fingerprints.
In this line, our tool provides a graphical representation of the structural similarity of any molecule with respect to the reference using six different fingerprints:
- Morgan
- Feat Morgan
- MACCS keys
- AtomPair
- RDKit
- Torsion
Once the fingerprints are calculated, the script would calculate the Tanimoto similarity of the selected molecules when comparing to a reference molecule. The results are plotted as a radial plot for easy comparison (Figure 1).
Drug-like DMPK
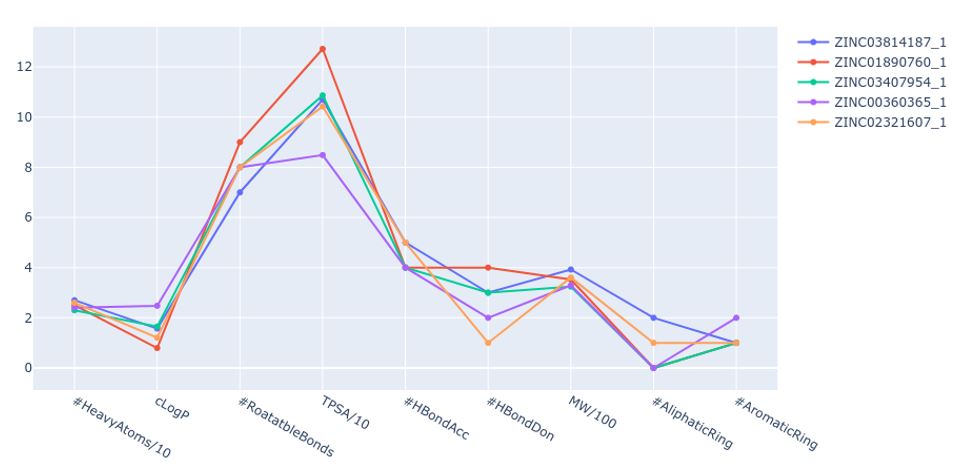
Macroscopic molecular properties are an important aspect to analyze before making the final selection. These properties are relevant when searching for new drugs, as they provide some insights into the pharmacological profile and potential ADME of a molecule.
The tool calculates and generates a graph (Figure 2) with parameters such as cLogP, number of rotatable bonds, aliphatic rings, or the amount of hydrogen bond donors and acceptors. This representation allows a simple comparison of the profiles of the top-ranked compounds. In addition, if a reference compound is selected, it is possible to compare the profile of the ranked molecules with the chosen reference.
Drug-like properties and toxicity
Finally, knowing the potential problems of a compound during clinical trials or assessing its toxicity provides additional information for compound selection. It is essential to understand the potential issues of the compound to decide whether to select it for testing or to discard it.
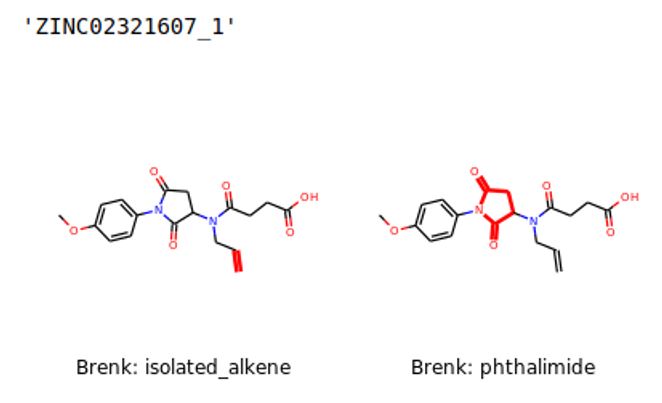
To address this issue, the latest functionality of this tool focuses on screening for potential problems related to toxicity and other issues during the pre-clinical or clinical phases. The tool screens each molecule in four libraries for potential interference and toxicity patterns. The warnings generated by these patterns are calculated and plotted on a graph (Figure 3). To facilitate the analysis, the tool highlights in a 2D representation of the compound the moiety responsible for generating the potential warning (Figure 4).
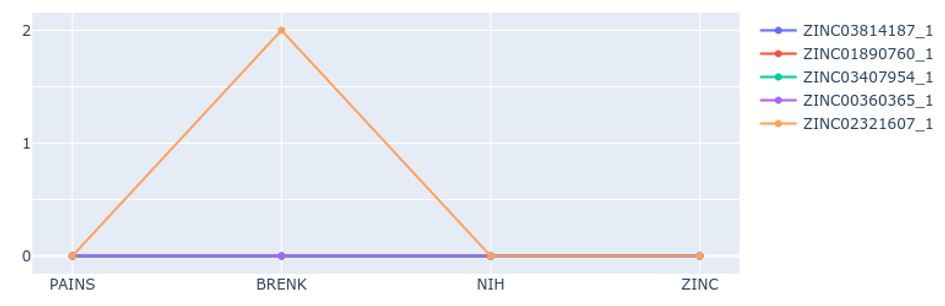
The toxicity parameters provided are:
- PAINS – Pan Assay Interference patterns [1].
- BRENK – Filters unwanted functionality due to potential tox reasons or unfavorable pharmacokinetics [2].
- NIH – Annotated compounds with problematic functional groups [3,4].
- ZINC – Filtering based on drug-likeness and unwanted functional groups. [5]
Download Tool
Want to learn more?
Contact us to explore this tool in combination with PharmScreen! This version of the Jupyter Notebook contains additional features to explore the chemical space using our ligand-based virtual screening tool.
PharmScreen, our ligand-based software, using unique and superior 3D representation of molecules, is an alternative to traditional computational approaches. It overcomes the bias commonly associated with other ligand-based approaches, because the hits it identifies are independent from the ligand-receptor interaction of the active reference compound, and it is an excellent complement to structure-based approaches.
References
- Baell JB, Holloway GA. New Substructure Filters for Removal of Pan Assay Interference Compounds (PAINS) from Screening Libraries and for Their Exclusion in Bioassay. J Med Chem 53 (2010). DOI: 10.1021/jm901137j.
- Brenk R et al. Lessons Learnt from Assembling Screening Libraries for Drug Discovery for Neglected Diseases. ChemMedChem 3 (2008) 435-444. DOI: 10.1002/cmdc.200700139.
- Doveston R, et al. A Unified Lead-oriented Synthesis of over Fifty Molecular Scaffolds. Org Biomol Chem 13 (2014). DOI: 10.1039/c4ob02287d.
- Jadhav A, et al. Quantitative Analyses of Aggregation, Autofluorescence, and Reactivity Artifacts in a Screen for Inhibitors of a Thiol Protease. J Med Chem 53 (2009).DOI: 10.1021/jm901070c.
- https://blaster.docking.org/filtering/