
Virtual Screening (VS) is a core in-silico technology in medicinal and computational chemistry. Several tools have been developed to exploit protein structures or collections of compounds to provide a quick and economical method for the discovery of novel active compounds. Hence, the comparative evaluation of VS algorithms becomes a fundamental exercise to assess the applicability of drug discovery tools. Here, we explain some metrics used to evaluate the accuracy of VS tools in retrospective studies, using known data sets of active and inactive compounds. The most common ones are the area under the receiver operating characteristic (ROC) curve (AUC), the BEDROC score, the enrichment factor (EF), and ROC enrichment (ROCe).
How do we measure accuracy?
ROC curves are one of the most used representations to compare VS algorithms performance. This kind of plot represents the relation between the fraction of true positives (active compounds) out of the total positives or sensitivity, versus the fraction of false positives out of the total negatives (inactive compounds) or specificity, as shown in Figure 1A. The closer the line to the upper left corner, the better, as it means that active molecules rank in the first positions of the ranking provided by a VS campaign.
The most intuitive and easy way to compare ROC curves is the AUC metric, representing the area value under the ROC curve. AUC values range from 0 to 1, where 1 indicates a perfect classification of the screened compounds (i.e. all active compounds ranked before the inactive compounds). On the other hand, values lower than or equal to 0.5 are considered a bad prediction and are associated with a random classification.
The argument against using AUC values resides in the difficulty to characterize the initial part of a ranked list, particularly when we compare algorithms with high AUC score. . For example, an identical AUC value for two different VS methods (A and B) does not necessarily mean that both methods perform equally. As illustrated in Figure 1B, although methods A and B have the same AUC values, method A finds more active compounds in the initial part of the ranking, whereas method B retrieves more active compounds in the last part of the ranking.
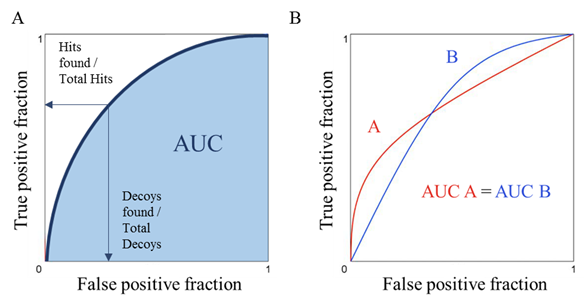
Figure 1. (A), Example of ROC curve. Hits: known active compound. Decoys: assumed non-active compounds. The shaded section (blue) is the area under the receiver operating characteristic (ROC) curve (AUC). (B), ROC curves for two different VS methods. Although VS method A (redline line) addresses the ‘‘early recognition’’ problem better than VS method B (blue line), their AUC are equal.
The early recognition problem
Early recognition of active molecules is of paramount importance in real-world screening applications, where researchers only test top-ranked molecules in biological assays due to their high costs. Hence, it is easy to argue that in the example above, method A performs better than method B. To evaluate this early enrichment behavior, several metrics have been proposed:
- The Boltzmann-Enhanced Discrimination of ROC (BEDROC) is a metric1 that assigns more weight to early ranked molecules than late ranked molecules. The active compounds are weighted depending on their position in the ranking using an exponential function, ranging from 1.0 for the top ranked compound to close to zero for the lowest ranked compound. The exponential factor determines how much the BEDROC parameter focuses on the top of the list.The drawbacks of this metric are its dependency of the ratio of active/inactive compounds and the dependency of an extrinsic variable (adjustable exponential factor). That means that the value depends on the method and a particular experiment. Hence, sets with different active/inactive compound ratios cannot be compared directly using such a metric.
- Enrichment Factor (EF) measures the fraction of active compounds found in a specific percentage, solving the problem of comparing the results for datasets with different active / inactive compound ratios. EF is a quite standard metric due to its intuitive interpretation related to the purpose of the VS itself (the ability to select a subset of molecules with a promising chance of finding a hit compound). However, although the EF metric is independent of adjustable parameters, it is still influenced by the number of active compounds in the dataset. EF becomes smaller if fewer inactive molecules are initially present.
- ROC enrichment (ROCe) is the fraction of active compounds divided by the fraction of false positive compounds at a specific percentage of decoys retrieved. It represents the ability of the test to discriminate between two populations: active and inactive compounds. This approach solves the active/inactive compound ratio dependency present in the previous metrics. This metric only gives information about a defined percentage. Jain and Nicholls2 suggest the 0.5, 1.0, 2, and 5 percentages to report the “early enrichment” values.
Exploring the chemical diversity
As discussed, several metrics solve the early recognition problem. But, none of them distinguish different scenarios regarding chemical diversity. In general, a VS tool that ranks a given number of active compounds of different chemical families in the first positions performs better than a tool that ranks the same number of active compounds but all belonging to the same or fewer chemical families. Clustering is a commonly used technique to classify compounds into different chemical families based on scaffold similarity. To account for chemical diversity, the ROC curve metrics have been adjusted as follows3
- Average-weighted ROC curve (awROC). The above scheme can be also embedded into the ROC enrichment. Thus, the value of the true positive hit is weighted depending on the cluster to which it belongs to and on the number of molecules in the cluster.
- Average-weighted Area Under the Curve (awAUC), can be interpreted as the probability that an active compound with a new scaffold is ranked before an inactive compound. Using an arithmetic weighting, each structure has a weight that is inversely proportional to the size of the cluster it belongs to. Therefore, the weight of all structures taken from one cluster is equal. Integrating this scheme into the basic AUC leads to an arithmetic weighted version (awAUC).
The main drawback of the metrics that account for chemical diversity is that they are very sensitive to the methodology that is used to group molecules into chemical families.
Conclusions
As discussed, the characterization of VS performance is of paramount importance to assess the applicability of these technologies in drug discovery. Despite the common aim of benchmarking studies, there is still no consensus on what is the best metric/s to analyze and compare results. Establishing standards in the field of cheminformatics, particularly in VS, is necessary to enhance the quality of publications and allow a reliable assessment of methods and progress.
What is your opinion in this regard? What metric/s are you using to assess virtual screening tools? Choose your preferred metric and leave your comments in the survey!
REFERENCES
(1) Truchon, J.-F.; Bayly, C. I. Evaluating Virtual Screening Methods: Good and Bad Metrics for the “Early Recognition” Problem. J. Chem. Inf. Model. 2007, 47 (2), 488–508.
(2) Jain, AN; Nicholls, A. Recommendations for Evaluation of Computational Methods. 2008, 22, 133–139.
(3) Clark, R. D.; Webster-Clark, D. J. Managing Bias in ROC Curves. J. Comput. Aided. Mol. Des. 2008, 22 (3–4), 141–146.